For the past couple of weeks we have been looking at how to graph data in order to create visual representations of information. Now I'd like to look at a couple of different graphic organizers which allow you to organize information visually to help better understand the meaning of the information with which you're working. This week we'll look at venn diagrams.
Venn Diagrams:
A venn diagram is a type of graphic organizer that allows you to specifically compare groups/sets/categories and understand which individual items they share in common. A venn diagram is made up of multiple circles that overlap. When organizing your information in the graph, each category has it's own circle, and items that belong in that category are placed in the labeled circle. Any items that belong in multiple categories are placed in the sections of the graph where their two (or more) categories overlap. Any new group of items created by the overlap of two or more categories is known as the intersection of those categories.
Parsha Connection:
Let's start by looking at a basic, two category, venn diagram using the information in this week's parsha about kosher animals.
First we draw the two circles- one for each category- and have them overlap in the center.


Now we look at the information that we are given about each category and separate our samples into the proper circles. Placing samples from overlapping categories into the overlapping sections of the diagram.

Finally, we label any sections that indicate a group for which no samples have been given. In our case, the Torah doesn't give us examples of any kosher animals, so we will label this section in the graph.

For our purposes, in our parsha example, we only had two categories to compare. However, you can compare many categories in this way. For each new category, a new circle is added, and the venn diagram provides a section for any combination of categories overlapping with each other.
In younger grades, students often begin by sorting items by shapes or colors to begin working with venn diagrams. In older grades, venn diagrams can be used for comparing sets of numbers and thinking about concepts such as intersections and unions of sets. Of course, these diagrams are also useful as graphic organizers for any subject, as well- to compare information between two literature pieces, about two different time periods, about different scientific concepts. Venn diagrams are a wonderful tool for any subject.
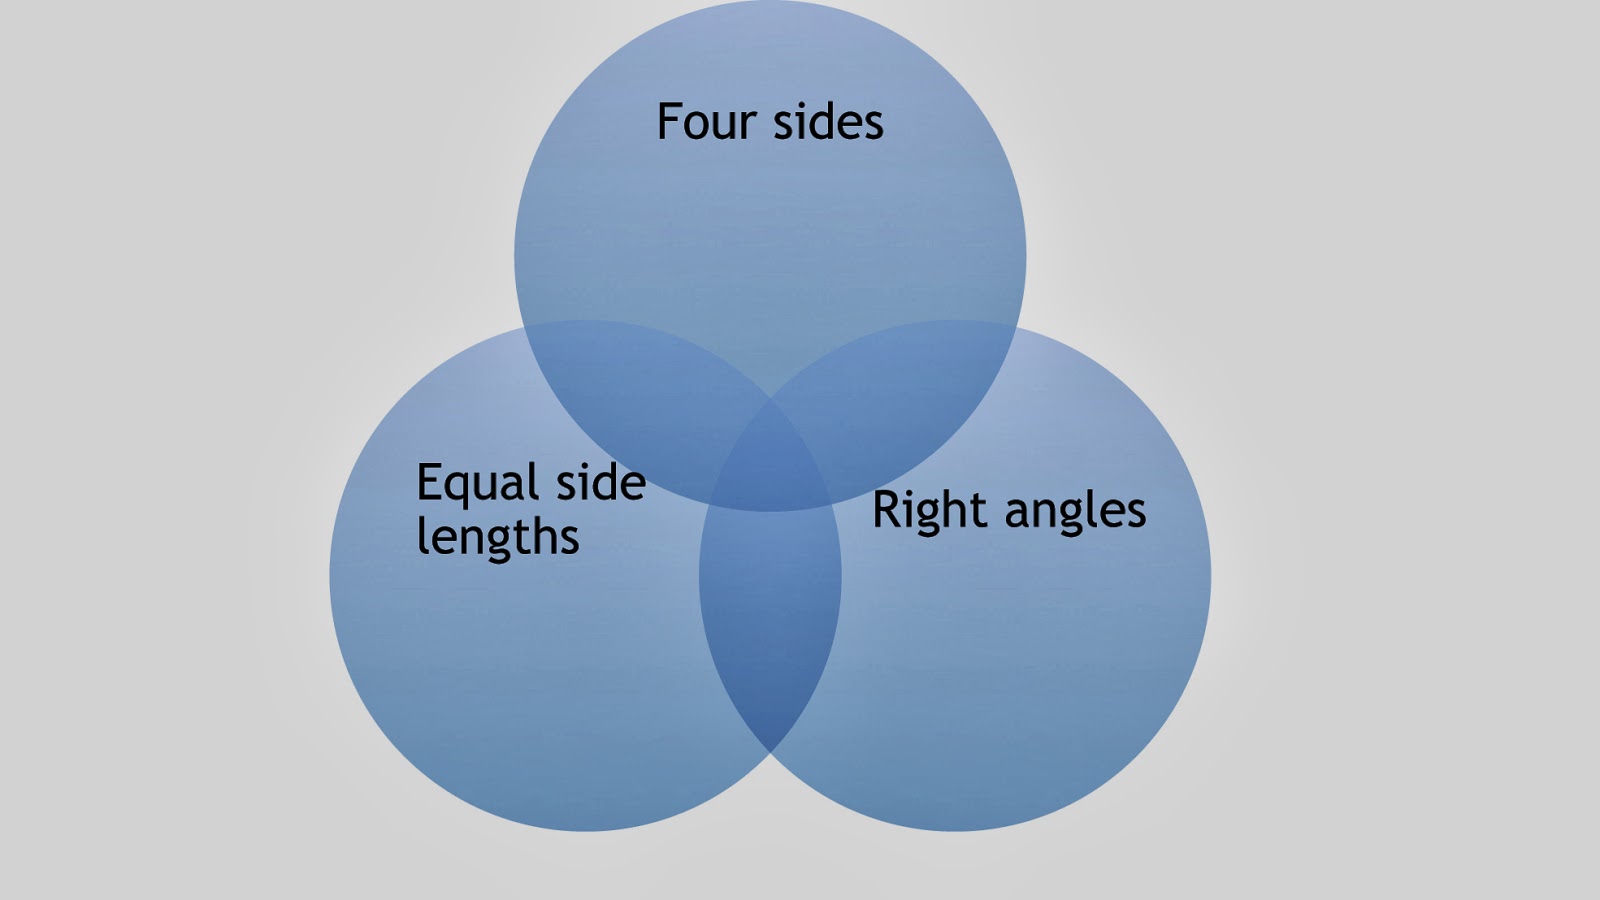
Here's a sample of a more complex, 3 circle diagram comparing shapes with 4 sides, shapes with right angles, and shapes with equal side lengths.
Here is the blank diagram set-up with the labeled circles:
And here is our completed diagram:

No comments:
Post a Comment