Thursday, April 3, 2014

Metzora- Following Directions (with a bonus flow chart)

This week's post is based on Vayikra 14;33-57. It is the section of the parsha where Hashem tells Moshe and Aaron how to handle cases of tzara'at on the structure of a person's home. 

Continuing in my theme of graphs and charts, this week we'll look at how to make sense of the information given by converting it into a direction based format. How can we break down the information into step-by-step instructions for a person or Kohen to follow? Processing information by following step-by-step instruction (younger grades) or by breaking it down into its basic steps (older grades) is a skill that is critical for learning logical thinking (younger grades) and then for creating logical solutions to solve problems (older grades).

Following Directions:
While helpful in many areas in life, being able to follow a given direction is an important tool for success in math. Given the logical, step-by-step nature of mathematics, establishing a process and following through with that process is a necessary skill for working through problems and developing methods for problem solving.

Parsha Connection:
In this week's parsha, Hashem gives Moshe and Aaron step-by-step directions for how to handle a case of tzara'at that is detected in the structure of a house. In order to "cure" the spiritual disease, it is important for the afflicted and for the Kohen to follow a specific order of directions. Let's break it down into the individual steps.

1) "...the one to whom the house belongs shall come and declare to the Kohen, saying: Something like an affliction has appeared to me in the house." ~Vayikra 14;35

2) "The Kohen shall command, and they shall clear the house when the Kohen has not yet come to look at the affliction, so that everything in the house should not become impure;"  ~Vayikra 14;36

3) "...and afterward shall the Kohen come to look at the house."  ~Vayikra 14;36

4) "He shall look at the affliction and behold!- the affliction is in the walls of the house, depressed, deep greens or deep reds; and their appearance is lower than the wall."  ~Vayikra 14;37

5) "The Kohen shall exit from the house to the entrance of the house;"  ~Vayikra 14;38

6) "...and he shall close off the house for a seven-day period."  ~Vayikra 14;38

7) "The Kohen shall return on the seventh day; he shall look and behold!- the affliction had spread in the walls of the house."  ~Vayikra 14;39

8) "The Kohen shall command, and they shall remove the stones that contain the affliction, and they shall cast them outside the city onto an impure place."  ~Vayikra 14;40

9) "And the house shall be scraped from within, all around; the mortar that they have scraped at the edges they are to pour outside the city onto an impure place."  ~Vayikra 14;41

10) "They shall take other stones and bring them in place of the stones; and they shall take other mortar and plaster the house."  ~Vayikra 14;41

Bonus: A Flowchart- Did the tzara'at return? (Vayikra 14;43-53)
At the end of the section about tzara'at in the home, we have information about how to determine if the home has been "cured" of tzara'at or if it is still present. This information can be organized nicely into the flowchart below.


Friday, March 28, 2014

Tazria- Conditional Statements and Flow Charts

"Hashem spoke to Moshe and Aaron, saying: If a person will have on the skin of his flesh a s'eit, or a sepachat, or a baheret, and it will become a tzara'at affliction on the skin of his flesh; he shall be brought to Aaron the Kohen, or to one of his sons the Kohanim. The Kohen shall look at the affliction on the skin of his flesh: If hair in the affliction has turned white, and the affliction's appearance is deeper than the skin of his flesh-it is a tzara'at affliction; the Kohen shall look at it and make him impure.
If it is a white baheret on the skin of his flesh and its appearance is not deeper than the skin, and the hair has not turned white, then the Kohen shall close off the affliction for a seven-day period. The Kohen shall look at it on the seventh day, and behold!- the affliction remained in its appearance, and the affliction did not spread on the skin, then the Kohen shall close him off a second time for a seven-day period. The Kohen shall look at it again on the seventh day, and behold!- if the affliction has dimmed and the affliction has not spread on the skin, then the Kohen shall declare him pure, it is a mispachat; he shall immerse his garments and become pure. But if the mispachat should spread on the skin after it had been shown to the Kohen for its purification, it should be shown to the Kohen again. The Kohen shall look, and behold!- the mispachat has spread on the skin; the Kohen shall make him impure; it is tzara'at." ~Vayikra 13;1-8

In continuation of our study of understanding information and organization of information using graphic organizers, this week we'll look at two new ideas: 1) conditional statements and 2) flow charts.

Conditional Statements:
Conditional statements are statements in "If..., then..." form that give you a piece of information that is based on whether or not the other part is true. For example, "If it rains, I will need my umbrella." This statement tells me that I may or may not need an umbrella, and the way to determine if I do is based on whether or not it rains. If it rains, yes, I do; if it doesn't rain, no, I don't. Conditional statements are used in math to organize information, and often students will work with conditional statements to determine whether they are true or false. "If a shape has four sides, then it's a square." This statement could be true, but is not always true, since there are other shapes that also have four sides, and our statement is not specific enough about the shape. Sometimes, switching the first and second clauses can make a false statement true- "If a shape is a square, then it has four sides." We just took a statement that is not always true and made it into one that is always true, since a square does always have four sides. Rearranging the order of clauses and adding or removing negatives in clauses of conditional statements can be a whole exercise on its own, and is typically studied in conjunction with beginning algebra concepts. For our purposes this week, we just need to understand what a conditional statement is.

Flow Charts:
Flow charts are an organizational tool that can be used to make sense of a process or "flow" of information. You start at one point and determine what that information leads you into. Often, there are two or more options that come out of one point and the flow chart helps you separate what happens in case 1 of this situation from what happens in case 2 of this situation. The flow chart offers a visual representation of the process in the situation with which you are working.

Parsha Connection:
In this week's parsha, we are told about the process that the Kohen must go through to determine whether or not a person has tzara'at. Using a flow chart to map out the conditional statements that are given, we can create a visual aid for understanding when a person is diagnosed with tzara'at (impure) and when they are ok (pure).

We begin by charting the initial situation along with any possible first step outcomes from the situation.


Next, we take each of those outcomes and see if a final decision is made or if there is a follow-up step that occurs as part of the outcome. In our case, if the person is determined to be either pure or impure then that path has ended; if a determination has not yet been made, then the path will continue.


Now we take the follow-up step and chart the possible outcomes from that step.


From here, we continue, as before, and look to see if a final decision was made and each path has ended, or if follow-up steps are required based on the outcomes. We chart each path until all paths end at either a pure or impure status.


This is just one situation that lends itself to being graphed in a flow chart in this week's parsha. Try your hand at flow charts by mapping out another situation.

Thursday, March 20, 2014

Shmini- Venn Diagrams

"Hashem spoke to Moshe and to Aaron, to say to them. Speak to the Children of Israel, saying: These are the forms that you may eat from among all the animals that are upon the earth. Any one among the animals that has a split hoof, which is separated with a split [into] hooves, and that brings up its cud- that one you may eat. But this is what you shall not eat from among those that bring up their cud or that have split hooves: the camel, for it brings up its cud, but its hoof is not split- it is impure to you; and the hyrax, for it brings up its cud, but its hoof is not split- it is impure to you; and the hare, for it brings up its cud, but its hoof is not split- it is impure to you; and the pig, for its hoof is split and its hoof is completely separated, but it does not chew its cud- it is impure to you. You may not eat of their flesh nor may you touch their carcass- they are impure to you." ~Vayikra 11;1-8

For the past couple of weeks we have been looking at how to graph data in order to create visual representations of information. Now I'd like to look at a couple of different graphic organizers which allow you to organize information visually to help better understand the meaning of the information with which you're working. This week we'll look at venn diagrams.

Venn Diagrams:
A venn diagram is a type of graphic organizer that allows you to specifically compare groups/sets/categories and understand which individual items they share in common. A venn diagram is made up of multiple circles that overlap. When organizing your information in the graph, each category has it's own circle, and items that belong in that category are placed in the labeled circle. Any items that belong in multiple categories are placed in the sections of the graph where their two (or more) categories overlap. Any new group of items created by the overlap of two or more categories is known as the intersection of those categories.

Parsha Connection:
Let's start by looking at a basic, two category, venn diagram using the information in this week's parsha about kosher animals.

First we draw the two circles- one for each category- and have them overlap in the center.


Next, we label each circle with the category that is represented there.


Now we look at the information that we are given about each category and separate our samples into the proper circles. Placing samples from overlapping categories into the overlapping sections of the diagram.


Finally, we label any sections that indicate a group for which no samples have been given. In our case, the Torah doesn't give us examples of any kosher animals, so we will label this section in the graph.


For our purposes, in our parsha example, we only had two categories to compare. However, you can compare many categories in this way. For each new category, a new circle is added, and the venn diagram provides a section for any combination of categories overlapping with each other.

In younger grades, students often begin by sorting items by shapes or colors to begin working with venn diagrams. In older grades, venn diagrams can be used for comparing sets of numbers and thinking about concepts such as intersections and unions of sets. Of course, these diagrams are also useful as graphic organizers for any subject, as well- to compare information between two literature pieces, about two different time periods, about different scientific concepts. Venn diagrams are a wonderful tool for any subject.

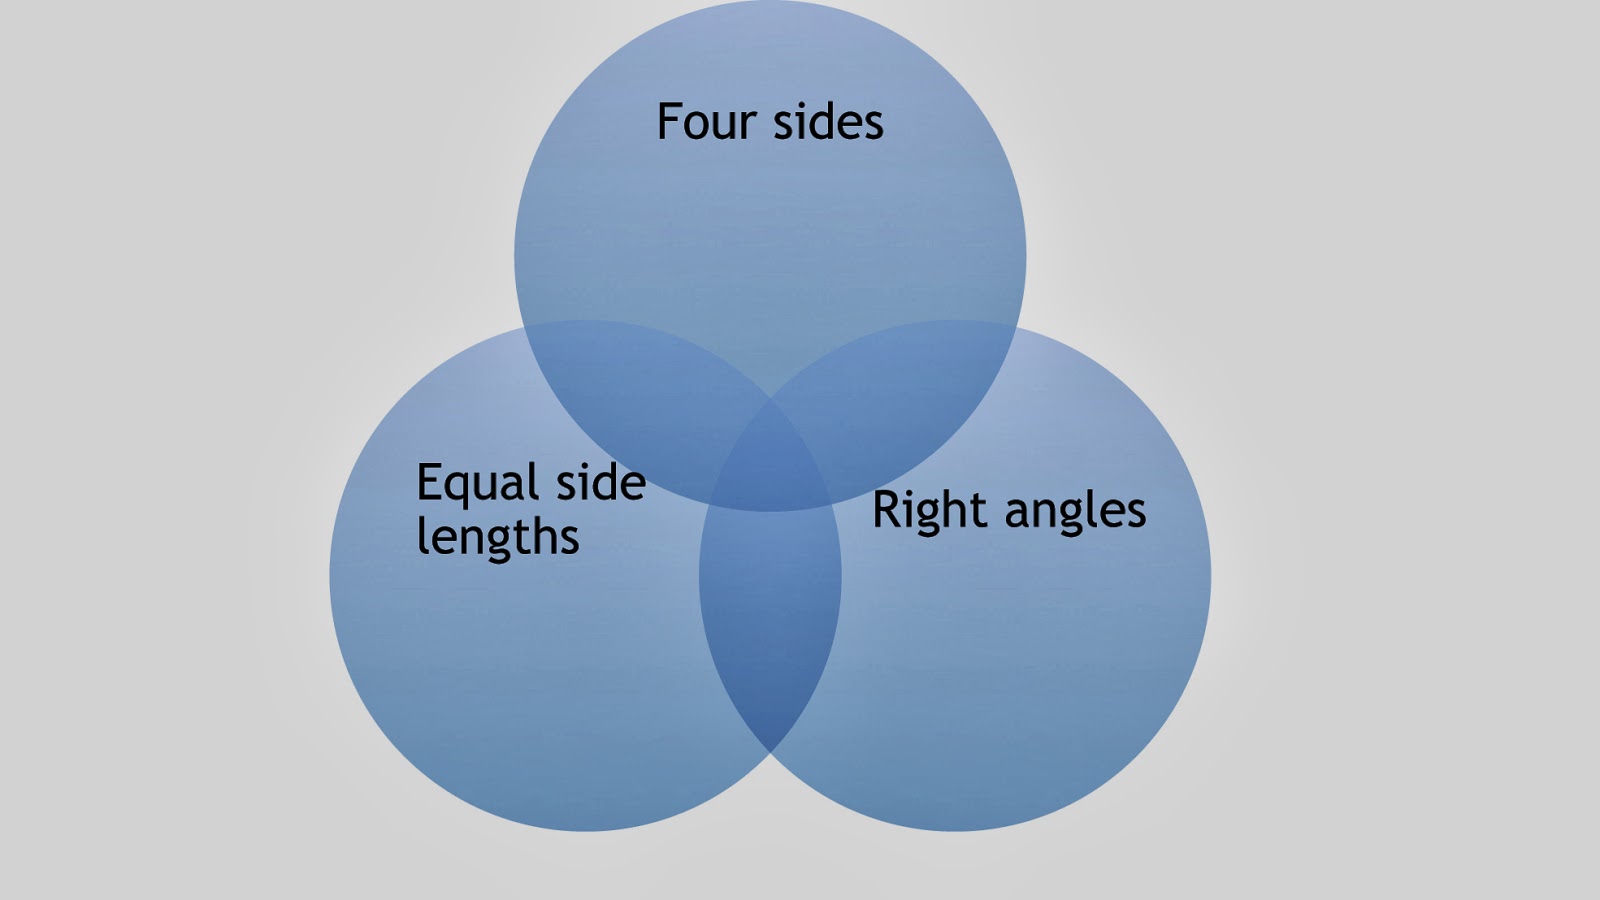
Here's a sample of a more complex, 3 circle diagram comparing shapes with 4 sides, shapes with right angles, and shapes with equal side lengths.

Here is the blank diagram set-up with the labeled circles:


And here is our completed diagram: